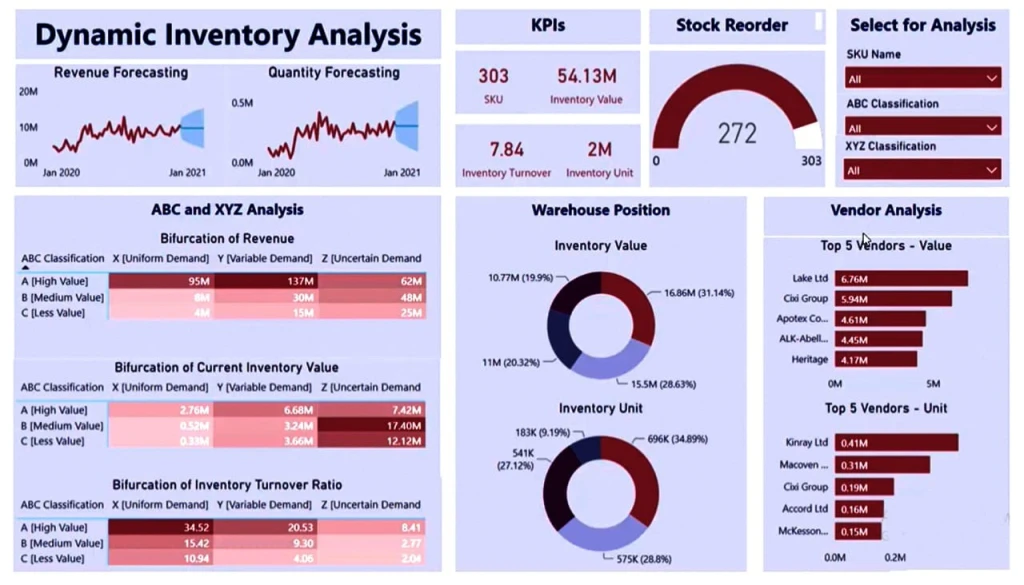
Real Time Data Analytics For Inventory

In today times, it just not enough for any Retailer or MSME Trader to prepare MIS at the end of each month for slow moving items or dead stock reports.
In current scenario, when business is operating effectively just for 6 months in year due to lot of future uncertainties, entrepreneurs get very less time to implement corrective actions. So we need to approach our problem more scientifically and analyse the past data to understand the future trends to take better decisions. We need to have live dashboards connected to our database and have 360 degree view of it.
We can look at one of the Practical Case study example where client is looking for solutions as below
Problem Statement
- Reduce inventory investment by 30%
- Institute a program to prevent the build up of obsolete inventories by disposing of slow movers on a regular basis.
- Demand planning/ Forecasting
Data Collection
- Sale Transaction Order History
- Purchase Transaction History
- Live inventory Data
- Product Item Dataset (Item Description, Price, Quality Features, Product Segments)
Case Analysis
- Inventory has to be analysis in terms of value i.e. ABC analysis and even in variability of demand factor i.e. XYZ Analysis
- Inventory lying in warehouse has to be analysed with its prospective customers for better engagement
Solution Statement
- What we found that two product in terms of value which was coming in X” category was not marketed to customers properly.
- Client was buying huge quantities of irregular demand product which comes in Z” category but in value terms it was coming under A” category so investment of client could be reduced by 15% percent.
Conclusion
In this new age data analysis, Inventory data cannot be seen in silo, we need to compare with its vendors database, customer database, product universe, external factors for the right approach of decision making.
In simpler terms, Inventory management means the technique to determine the optimum level of inventory at firm level and for each SKU of the product range. Now to do same u need to apply Data Science and Visualisation Analytics tools to take better decisions.
Share
Subscribe
